Many people don’t know that every time a website is loaded, it is responsible for carbon emissions. In fact, estimates suggest that if the Internet were a country, it would be the world’s seventh-biggest polluter. Even if we can’t easily see the footprint that cyberspace leaves on our physical environment, the impact is certainly real.
As part of our #LetsGreenTheWeb campaign, we’re collaborating with tech workers in the Web Industry to raise awareness of the huge role that websites play in contributing to global carbon emissions. The thing that we want to shout about, is that making a website produce less carbon emissions has a lot of fantastic co-benefits such as faster loading times, better usability experience for visitors and often reduce costs in the long-term to sustain your website. We have every reason to get better at this as an industry!
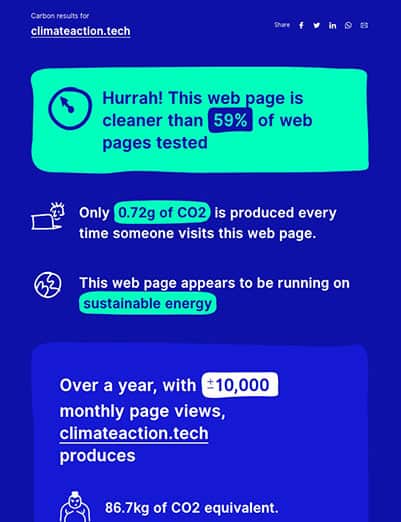
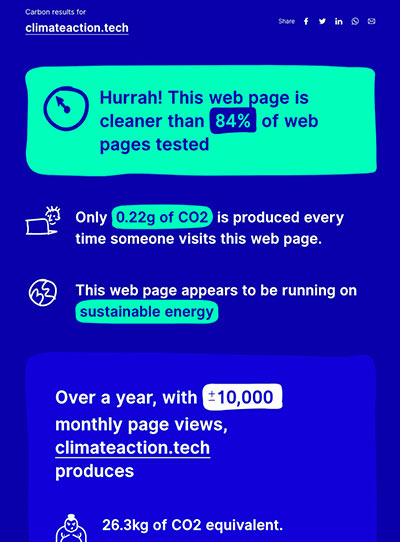
So, we followed the recommended steps from our own Reduce the carbon emissions of your website Action Guide, and checked our homepage emissions using the Website Carbon Calculator. Here’s an account of what we did to increase our score from 59% to 84% on the calculator, and reduce the estimated carbon emissions from each page load from 0.72g to 0.22g.
Summary of key topics
How we achieved our starting score of 59%
Our first score taken on the Website Carbon Calculator was 59%. Not a bad score for our baseline measurement.
As Climate Action Tech is a community run by volunteers, working to accelerate climate action in our spare time, we have to approach our website as a work in progress. We know we can always do more, and our aim is of course to build a website that produces the absolute minimum of emissions.
But we have to be realistic about the time and skills we have available, and take a pragmatic approach to what we can do versus what we’d like to do. We don’t think we’re different to any other business or organisation in that regard – we all have time, skills and budget restraints holding us back.
So when setting up the first version of the site you see today, we made a few deliberate, yet easy choices to minimise our impact.
The website is made using our own hosted version of the open-source CMS, WordPress. This was a choice made because the code is open-source, and we have a good knowledge of how to get the most out of WordPress in the community. That helps us spread the load of managing the site among more people, making our online presence more sustainable over time. Web sustainability is a broader topic than reducing carbon emissions, and you read more about that on the MightyBytes Web Sustainability Guide.
Anyway, let’s stay focused on reducing carbon emissions and how we got our first score of 59%.
Hosting
Switching your site’s hosting to servers that run on renewable energy is estimated to reduce your site’s carbon emissions by approx 10%, so it’s certainly worth doing. A good hosting company will often migrate your site for free, making it usually a hassle free process. How to choose a green web host is a good read if you’d like some top tips on how to make this choice.
We chose UK based company Krystal and their managed WordPress hosting service for the Climate Action Tech website you see today. We chose Krystal, not only for their good customer support and fast loading times, but because their servers are powered by renewable energy. Additional as a company they have a clear, and transparent sustainability policy. Testing our site on The Green Web Foundation directory shows us that our hosting with Krystal is indeed listed as running on renewable energy.
WordPress theme
For those familar with WordPress, you’ll know that you need to choose a theme to install on your site. A WordPress theme controls how your site looks to a user and to some degree the options you have for laying out your content. We choose the Neve theme as the basis for our site because it is well-coded and loads quickly.
The speed of a website is an important factor to consider when thinking about its carbon emissions. It’s not a direct comparision – a fast loading site doesn’t always equal a site with low emissions – but it is a good guide. From reading articles like How Improving Website Performance Can Help Save The Planet, we knew that a performant theme would help us achieve a fair emissions score without too much effort.
What we discovered we could do better
For our initial launch our main priority was to get the site up and running with the right content and branding to communicate our goals. At this point, apart from the points mentioned above we didn’t put too much time and effort into optimising what we were doing.
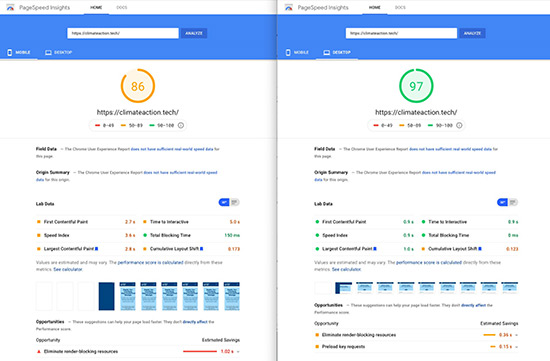
After launch however, we were able to let the dust settle and take a look at how we were doing. Using number of different measurement tools including the Website Carbon Calculator, Lighthouse, Google Page Speed Insights and SiteSpeed.io, and the knowledge of an experienced WordPress developer, we were able to analyse where we could make improvements from our baseline measurement.
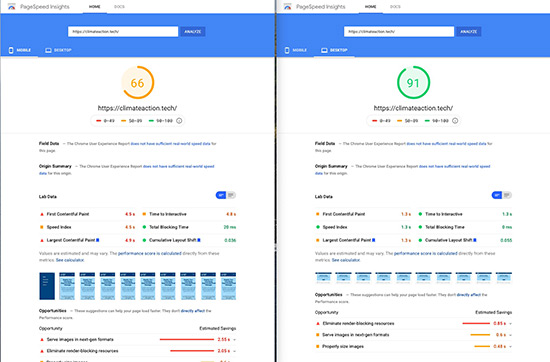
We spotted an obvious problem with our site’s media, specifically images and video. The file sizes of our images were generally larger than they needed to be, meaning we were transferring more data over the wire than necessary.
Every byte of data sent by your website consumes electricity. So reducing the amount of data being sent helps to use less electricity, and therefore reduce the emissions of our site.
Media optimisation
We started by looking at the images we were loading on each page and how we could make their file size smaller. We also sought other opportunities to remove any data being sent unnecessarily sent on each page load. Those familiar with website performance will know that image optimisation is a huge factor in how fast a website loads. For more information read What Is Image Optimization And Why Is It Important For A Website.
Here’s the specific changes we made with regards to media optimisation.
We replaced pngs with jpgs of smaller dimensions
We realised that most of the images in the site pages were pngs. This was the wrong format for the kind of images in question, which were complex images (like photos) and not vector based art. Different image formats hold varying advantages from one another, and those advantages can make a huge difference when it comes to filesize. For more info, check out 10 Types of Image File Extensions and When to Use Them.
We replaced all the inappropriate pngs with jpegs. When saving out the jpgs we used Photoshop and saved them at around 50-60% quality. Reducing their quality is fine in our context, we don’t need razor sharp image and this approach makes some major file size savings.
A few examples:

Was a png
dimensions: 547px × 365px
filesize: 280 KB
Now a jpg
dimensions: 547px × 365px
filesize: 62 KB
Was a png
dimensions: 1,920px × 845px
filesize: 1.2 MB
Now a png
dimensions: 690px × 304px
filesize: 51 KB

Was a png with transparent background
dimensions: 1,862 px × 1,047px
filesize: 770 KB
Now jpg with dark blue background
dimensions: 1140px × 640px
filesize: 119 KB

Was a png
dimensions: 1,920 px × 1,080px
filesize: 535 KB
Now a jpg
dimensions: 690px × 388px
filesize: 37 KB
We further optimised images on upload
There are other ways to further reduce the file size of images. One of those ways is to strip out other unneeded information from the images, such as metadata. This metadata is usually saved by a digital device when the photo is taken and includes information such as the camera make/model, shutter speed, aperture, lens model, etc.
This information is of little value to someone viewing an image on a webpage so can be stripped out.
We installed a plugin called Smush by WPMUDEV to do this for us. This doesn’t make as much improvement as getting the right image format in the first place, but it quietly works in the background with no further input needed once you have installed it, and provides an easy marginal file size saving on each image.
We set the site to lazyload images and video
Lazy loading is a technique for only loading images when a user is going to actually see them. You can read Use lazy-loading to improve loading speed to get a great overview on this topic. By not transferring images that aren’t going to be seen, you can send a lot less data over the wire.
We installed a plugin called Lazy Load – Optimize Images by WP Rocket to make sure that all browsers made use of this fantastic filesize saving technique.
Minify and combine JS and CSS
Moving on from media optimisation, we also implemented a common web performance technique to minify and combine our site’s JS and CSS files. We used a plugin called Autoptimize by Frank Goossens to automatically do this for us.
Autoptimize minifies JS and CSS files by removing all the spacing that makes the code human readable, this makes the file size smaller. It also combines the CSS and JS into one file respectively which means the browser has to make fewer requests to get the assets it needs from other places, which is also faster and uses less electricity. However, the combination side of things is unlikely to make a huge difference if your site is using the HTTP2 protocol, which is most likely.
Plugin clearout
Another issue that can dog WordPress website performance is the careless use of plugins. Using a plugin in itself isn’t bad, but using too many or choosing plugins that aren’t well coded can give you a performance headache. One of the last steps we took was to do a plugin review and make sure that any plugins we didn’t need were deleted from the site.
There are a few reasons why we want to get rid of plugins, or in fact any type of third party code that’s not being used:
- You will still be encouraged to make updates to the code even if its not in use. Code updates will transfer data to your site i.e. the new code, and that consumes electricity. Binning the plugin stops that happening.
- In some cases an activated plugin will load assets into your site even if it is not being used, and those assets will be downloaded by your browser when you view the site. Again another data waste that’s easy to take care of and also makes for a faster loading time, which your users will appreciate.
Summary
In all, it took an experienced WordPress developer about three hours to diagnose these issues and remedy them. Given the significant improvements to our Website Carbon Calculator score, we’d say those were three hours very well spent for our site visitors, and of course also for the planet.
Future improvements
As we all know a website is never done, and we of course want to make our website emit as little possible. Here are a few other things we want to try when we get the chance:
Replace a few of the other site’s plugins, in particular The Easy Social Icons plugin. This loads 35KB of CSS to style two icons in the footer of the site, and this is definitely far too much for the visual change we get in return. We’d like to find a better alternative to this.
We would also like to enable a CDN (Content Delivery Network) as we have visitors from across the world and currently our servers are based in the UK. A CDN would put our content nearer to our visitors and this means the data from our site has less distance to travel. Less distance to travel = less electricity used to send the data = fewer emissions.
We’d also like to make use of a more modern image format called WebP. Typically you need to pay for plugins that enable your website to serve up these images. Webp is smaller in filesize but not supported in all browsers, so not as easy to upload that format, you need some code to detect the browser and then serve the right format for you.

All of this made me realise that design education is lacking in covering sustainability as a topic. I was definitely taught wrong in design school. I was taught PNGs were best for web and JPEGs were only to be used in print. 🤦♀️ Glad I unlearned this now!
I couldn’t agree with you more. It’s shocking with all these developments the education system hasn’t changed.
I’m part of this community, and albeit I’m not a designer, I’m just so impressed that you all do this. But it’s also what makes it so exciting: we all have skills and expertise to share, and different elements to bring to the table. It’s really encouraging, too, to see how that collaboration can look like. Keep it up!
Good work on optimising the site. A few more points of feedback that could be helpful:
1. Images
The recommend image format for the web today is WEBP and no longer JPG. WEBP is supported by all browsers (for Safari only Safari 14 on BigSur). Work is being done on newer image formats such as AVIF and JPEG200 that will offer even better performance.
Related resources:
– https://web.dev/serve-images-webp/
– https://jakearchibald.com/2020/avif-has-landed/
– https://netflixtechblog.com/avif-for-next-generation-image-coding-b1d75675fe4
– https://almanac.httparchive.org/en/2019/media
2. Caching
The site is only making limited use of caching. The assets (images, css, js, etc) are being cached through CloudFlare but the actual html is not cached and is generated by WordPress for each request which is a waste of unneeded resources.
Besides making sure your page weight is limited you should try to focus on:
– Cache as much as possible
– Cache as close as possible to the user
Related resources:
– https://almanac.httparchive.org/en/2019/caching
3. Theme
A test with Yellowlab shows: https://yellowlab.tools/result/fve2ewupyr that the css is very complex and the site is loading a total of 4 different fonts for a total of 204 kb, thats about 50% of the overall page weight (https://yellowlab.tools/result/fvsjev32to) Reducing the amount of fonts to 1 or max 2 would have a big impact.
4. Website carbon calculator
The website carbon calculator provides a very rough generic estimation. It takes the total transferred bytes and applies a generic formula on those. It doesn’t consider:
– Caching
– Any data that was lazy loaded
– Iframe embeds (videos, tweets, …)
To give a better idea of the improvements you made you could consider comparing them with real world data from https://httparchive.org/
For example, the average real world page weight today is +/- 2mb, https://httparchive.org/reports/page-weight, and the total page weight of the frontpage of your site is 400kb (https://yellowlab.tools/result/fvsjev32to) which is an 80% optimisation over the real world average.
Other real world data you can consider comparing is:
– Total bandwidth
– Total requests handled by caches vs total requests generated by server
– TTFB (time to first byte)
– Cost of server infrastructure
Hope this helps.
Great improvement and very motivating to look on your ideas.
For image reduction I always use https://shortpixel.com where I like the comparission of PNG and WebP files.
And I sometimes wonder, that WebP is not always the smallest file format. So it’s always worth testing.